Charging Station Information
Overview
The Charging Station Information dashboard provides valuable insights on the state and developments of the EV charging infrastructure.
This dashboard includes information about operator market shares, location types, power levels, hardware overview, and the historical development and trend line of the market.
Settings and Filters
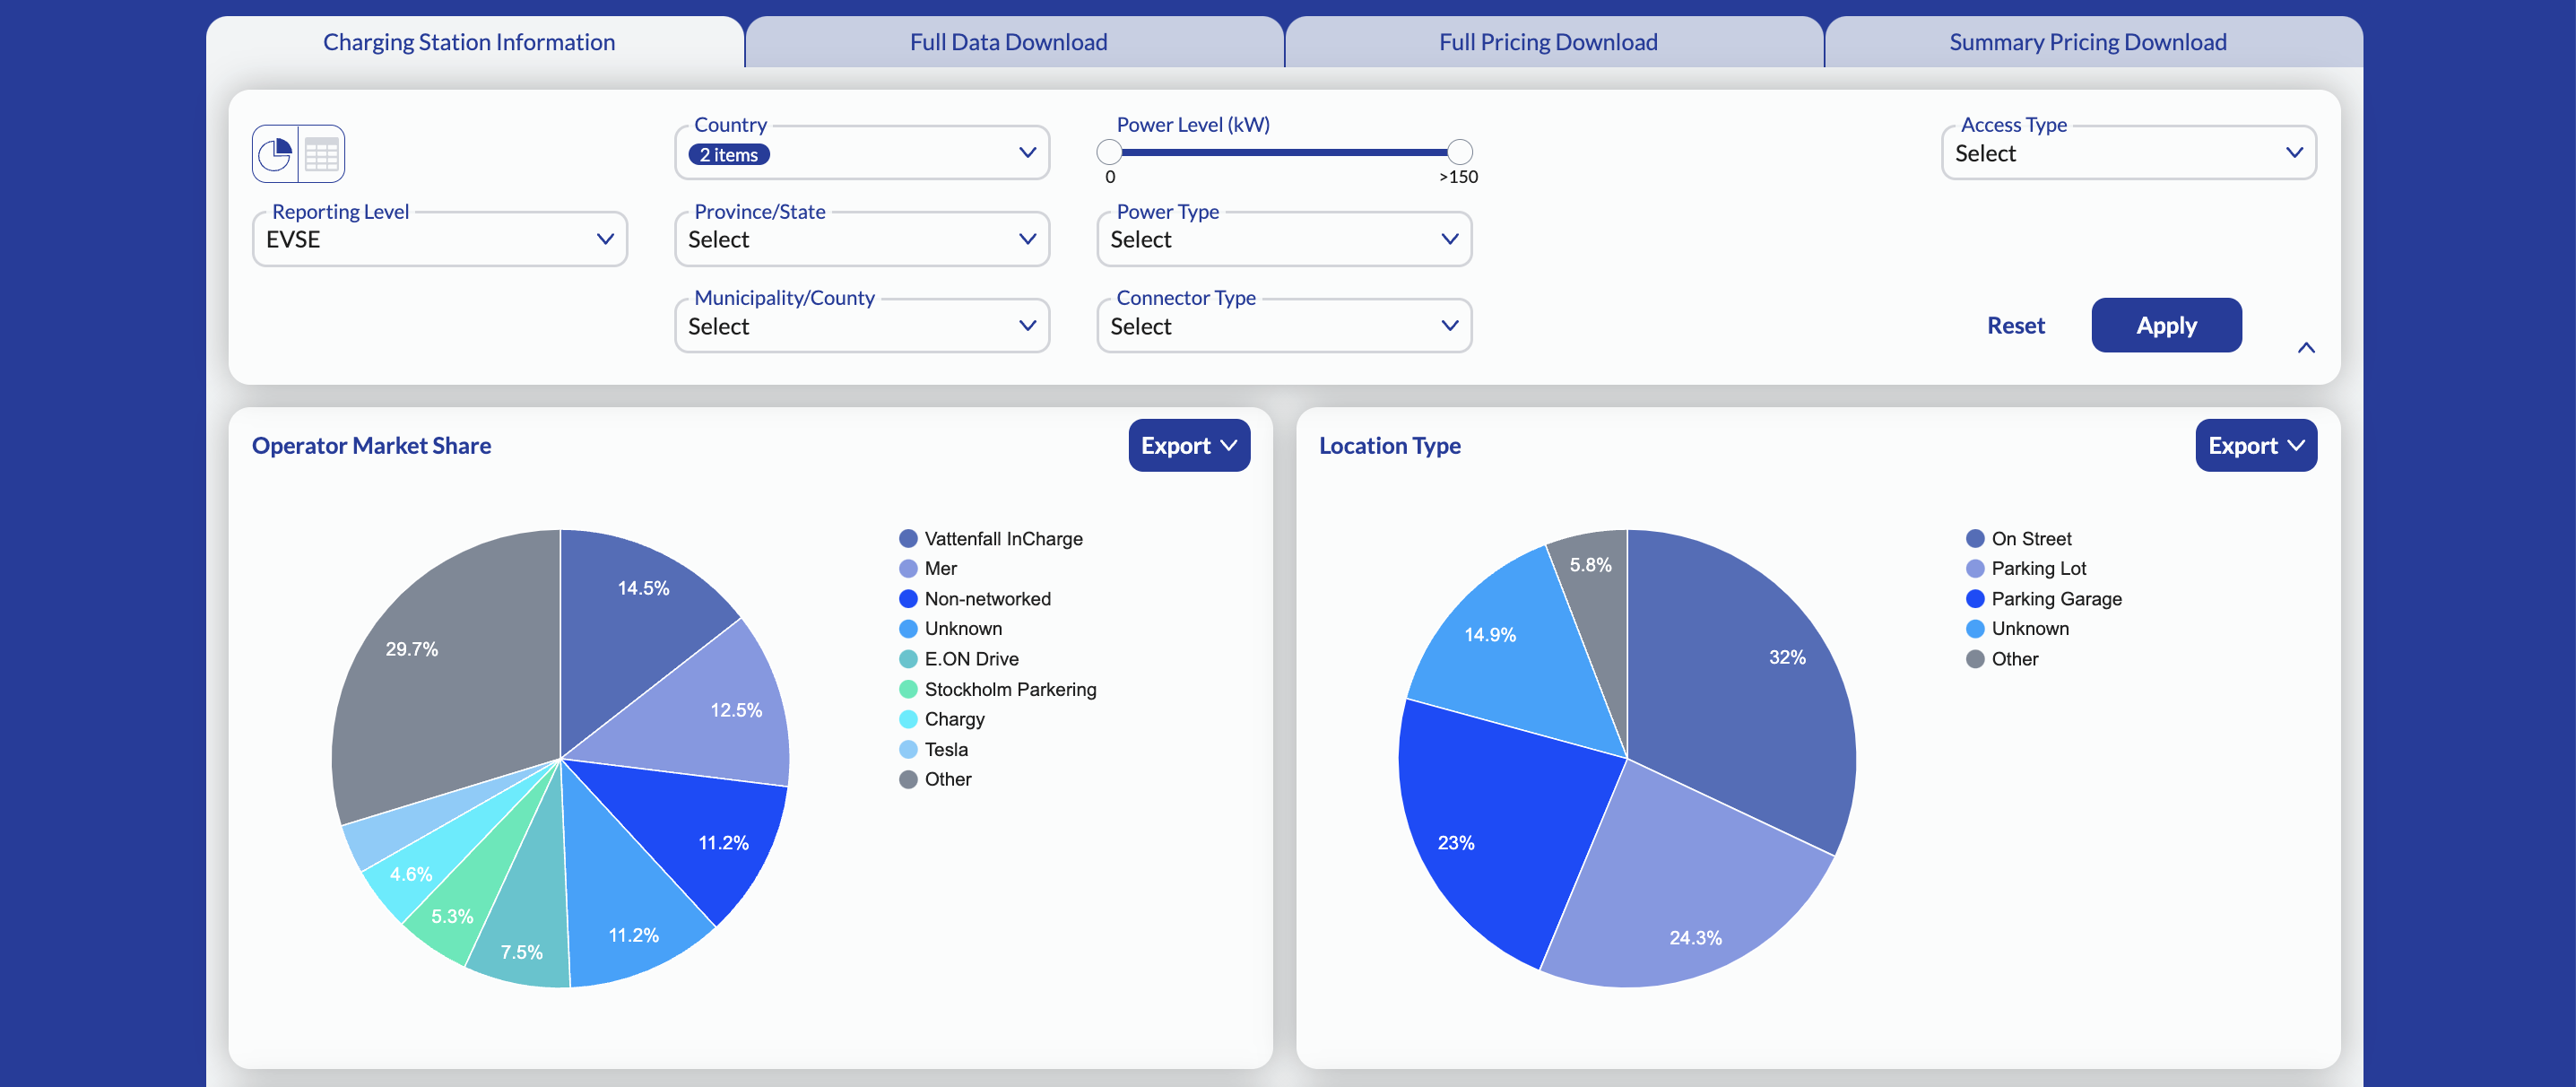
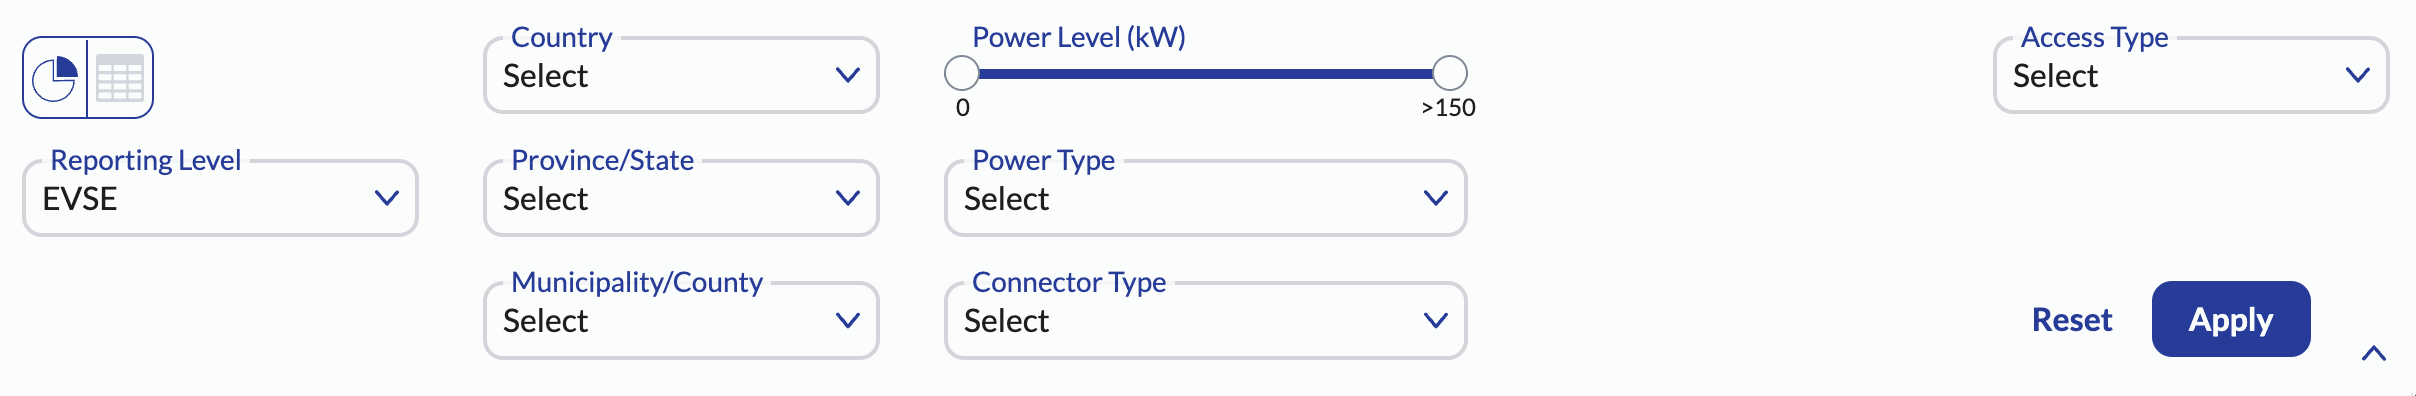
Use the settings and filters provided in the dashboard to customize and filter the data displayed in the dashboard. By default, information for all operators at the EVSE reporting level is displayed using pie charts.
Settings
The following table describes the settings you can use to customize the data shown in the Charging Station Information dashboard.
| Setting | Description |
|---|---|
| View | View the data as pie charts or tables. |
| Reporting Level | View the data specific to a location, EVSE, or connector. |
Filters
The following table describes the filters you can use to filter the data shown in the Charging Station Information dashboard.
| Filter | Description |
|---|---|
| Country/Region | Filter the data based on the country or region. You can select one or more values. |
| Province/State | Filter the data based on the province or state. You can select one or more provinces or states. |
| Municipality/County | Filter the data based on the municipality or county. You can select one or more municipalities. |
| Connector type | Filter based on the connector types. You can select one or more connector types. |
| Access Type | Filter based on the access types (Public, Restricted, and Private). You can select one or more access types. |
| Power Level (kW) | Filter based on the power level. Use the slider to select a power level. |
Operator Market Share
Use the Operator Market Share pie chart or table to gain insights on the market share of operators in the selected countries. The information can be viewed as a pie chart or a table.
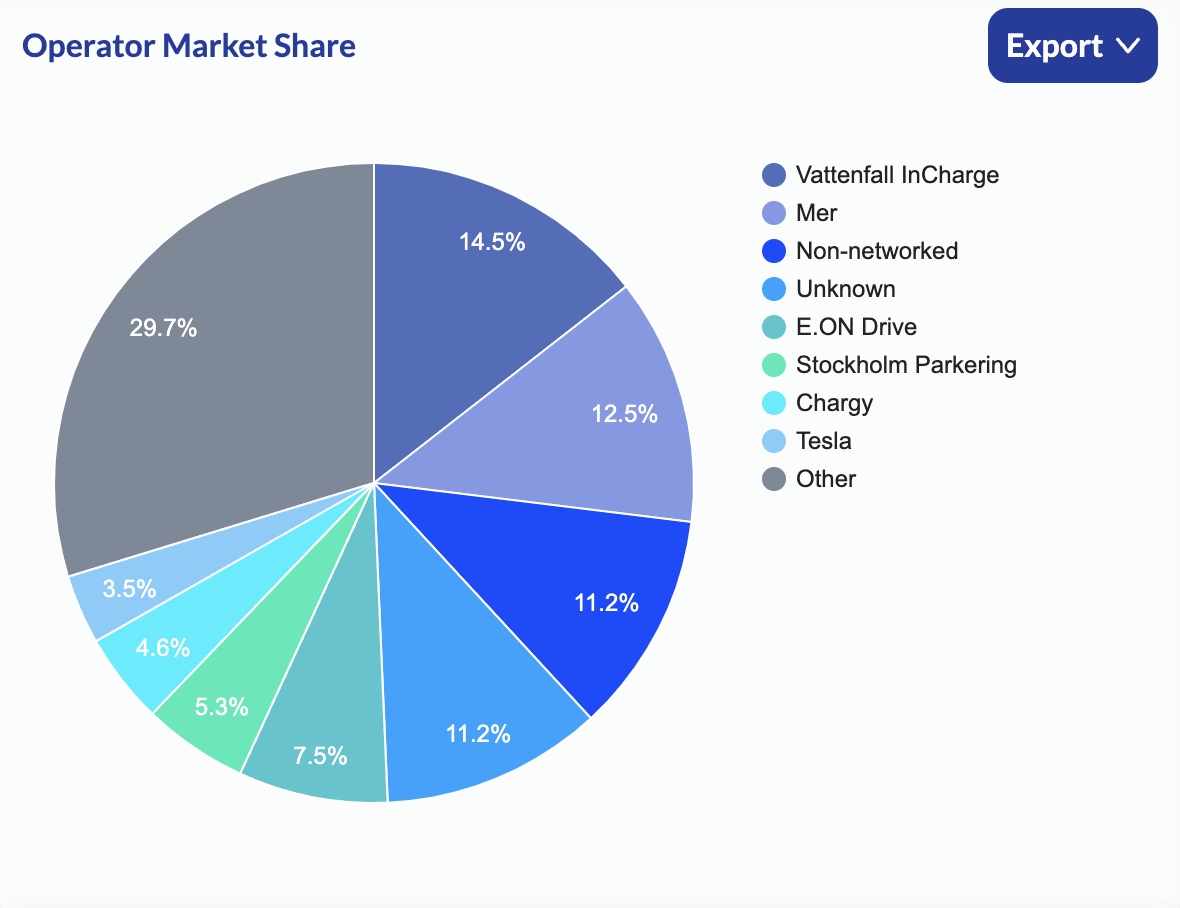
Click Export to download the data to a CSV or PNG file.
Note
Operators with a small market share are grouped under ‘Other’. Click the slice named 'Other' to see the operators grouped as 'Other'.
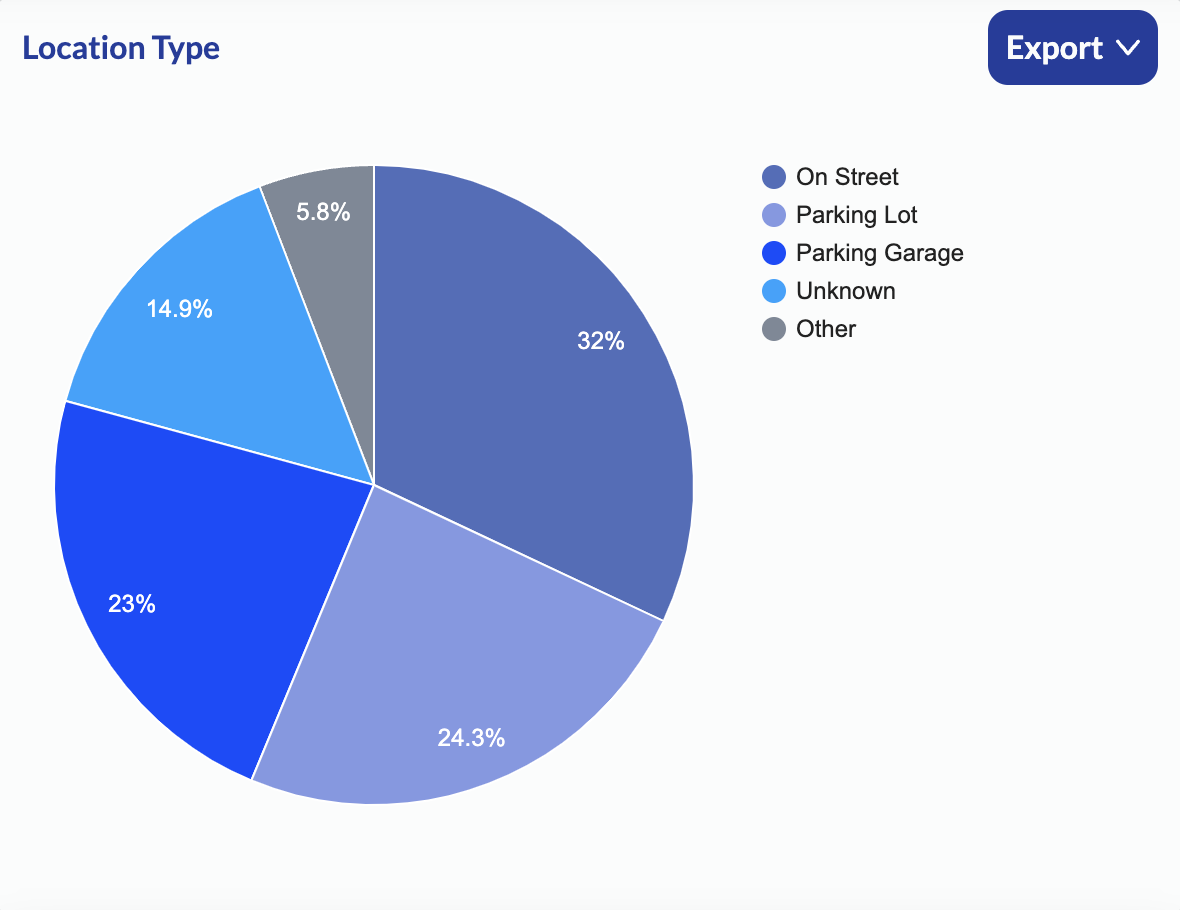
Location Type
Use the Location Type pie chart or table to understand the division of location types. The data shows where the charging unit is located. The information can be viewed as a pie chart or a table.
Note
The pie chart or table displays only the location types you selected for filtering.
The following table describes the location types:
| Location Type | Description |
|---|---|
| Along Motorway | The charging unit is on a parking facility or resting area along a motorway, freeway, interstate, highway etc. |
| On Street | The charging unit is in a public place with parking. |
| Parking Garage | The charging unit is in a multi-storied car park. |
| Parking Lot | The charging unit is in a parking lot. For example, at supermarkets, bars, etc. |
| Underground Garage | The charging unit is in an underground, multi-storied car park. |
| Unknown | The location type is not known. |
Click Export to download the data to a CSV or PNG file.
Note
Location types with a small share are grouped under ‘Other’. Click the slice named 'Other' to see the location types grouped as 'Other'.
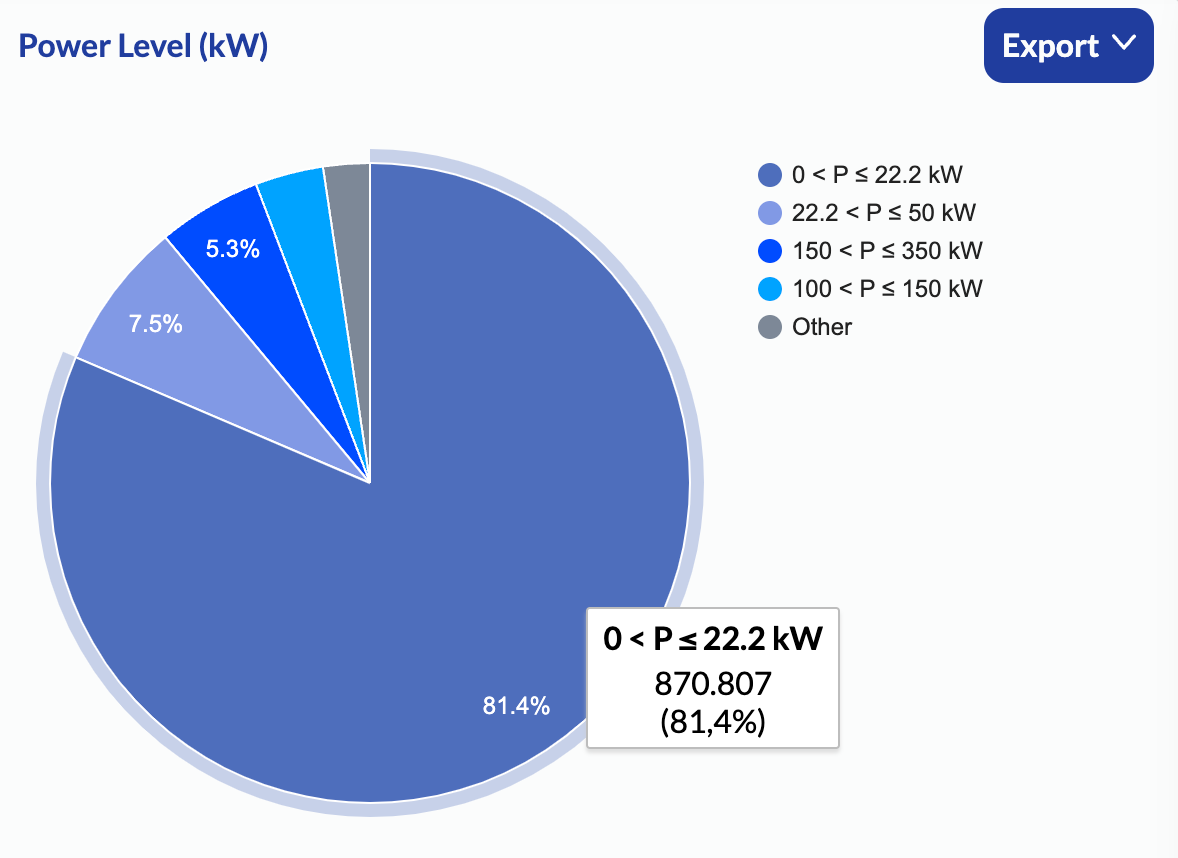
Power Level (kW)
Use the Power Level pie chart or table to understand the division of power levels. The information can be viewed as a pie chart or a table.
Note
The pie chart or table displays only the power level you selected for filtering. At the connector level, counts of connectors in power levels outside of your selection are also displayed if the location has a connector within your selection.
Click Export to download the data to a CSV or PNG file.
The following table describes the power levels:
| Power Level (kW) | Description |
|---|---|
| 0 < P ≤ 22.2 kW | The charging stations with a power level greater than 0 kW and lesser than 22.2 kW. |
| 22.2 < P ≤ 50 kW | The charging stations with a power level greater than 22.2 kW and lesser than 50 kW. |
| 50 < P ≤ 100 kW | The charging stations with a power level greater than 50 kW and lesser than 100 kW. |
| 100 < P ≤ 150 kW | The charging stations with a power level between 100 kW and 150 kW. |
| 150 < P ≤ 350 kW | The charging stations with a power level between 150 kW and 350 kW. |
| P > 350 kW | The charging stations with a power level greater than 350 kW. |
Note
Power levels with a small share are grouped under ‘Other’. Click the slice named 'Other' to see the power levels grouped as 'Other'.
Hardware Overview
Use the Hardware Overview pie chart or table to get valuable insights on the hardware manufacturers and models at charging stations, and understand how hardware is distributed based on the country or region, CPO, and location type.
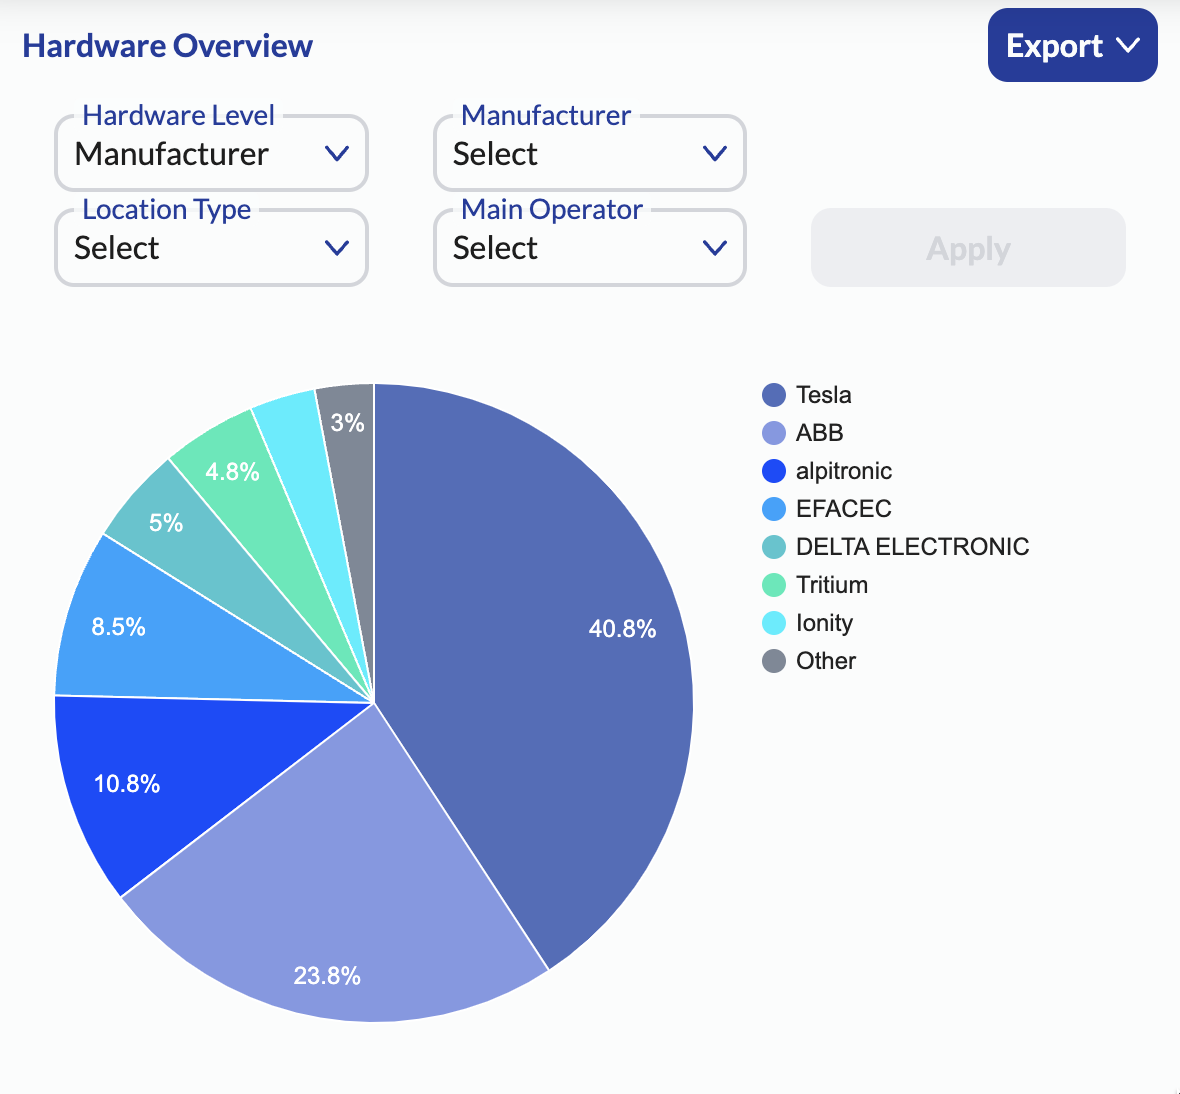
Filters
Use the filters specific to Hardware Overview to customize and filter the data. By default, information for all operators at the hardware manufacturer level is displayed using a pie chart.
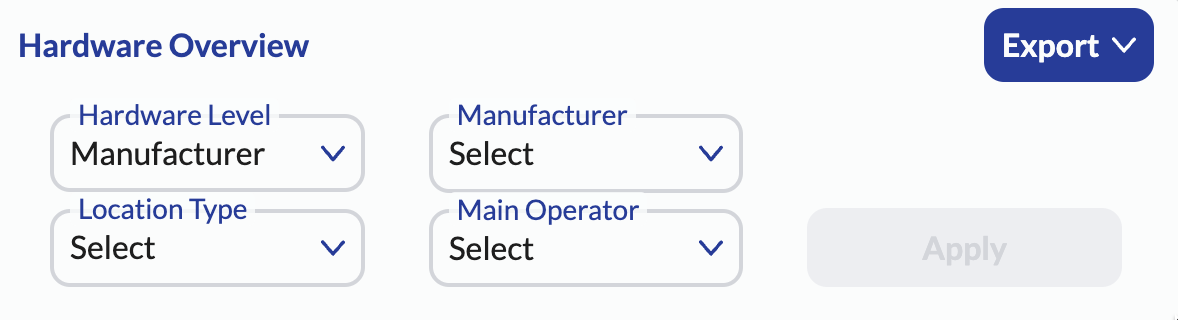
The following table describes the filters you can use to filter the data.
| Filter | Description |
|---|---|
| Hardware Level | Choose whether to show only hardware manufacturers or models. |
| Location Type | Filter based on the location types. You can select one or more connector types. See Location Type in the Charging Station Information dashboard for a description of the available location types. |
| Manufacturer | Filter the data based on the manufacturer. You can select one or more manufactures. |
| Main Operator | Filter the data based on the operator. You can select one or more operators. By default, all operators are shown regardless of your selection in other filters. |
Note
Hardware manufacturers with a small share are grouped under ‘Other’. Click the slice named 'Other' to see the hardware manufacturers grouped as 'Other'.
Download
Click Download to download the data to a CSV or PNG file.
Market Development
Use the Market Development line chart or table to get a historical overview of charging stations development in the selected countries or regions.
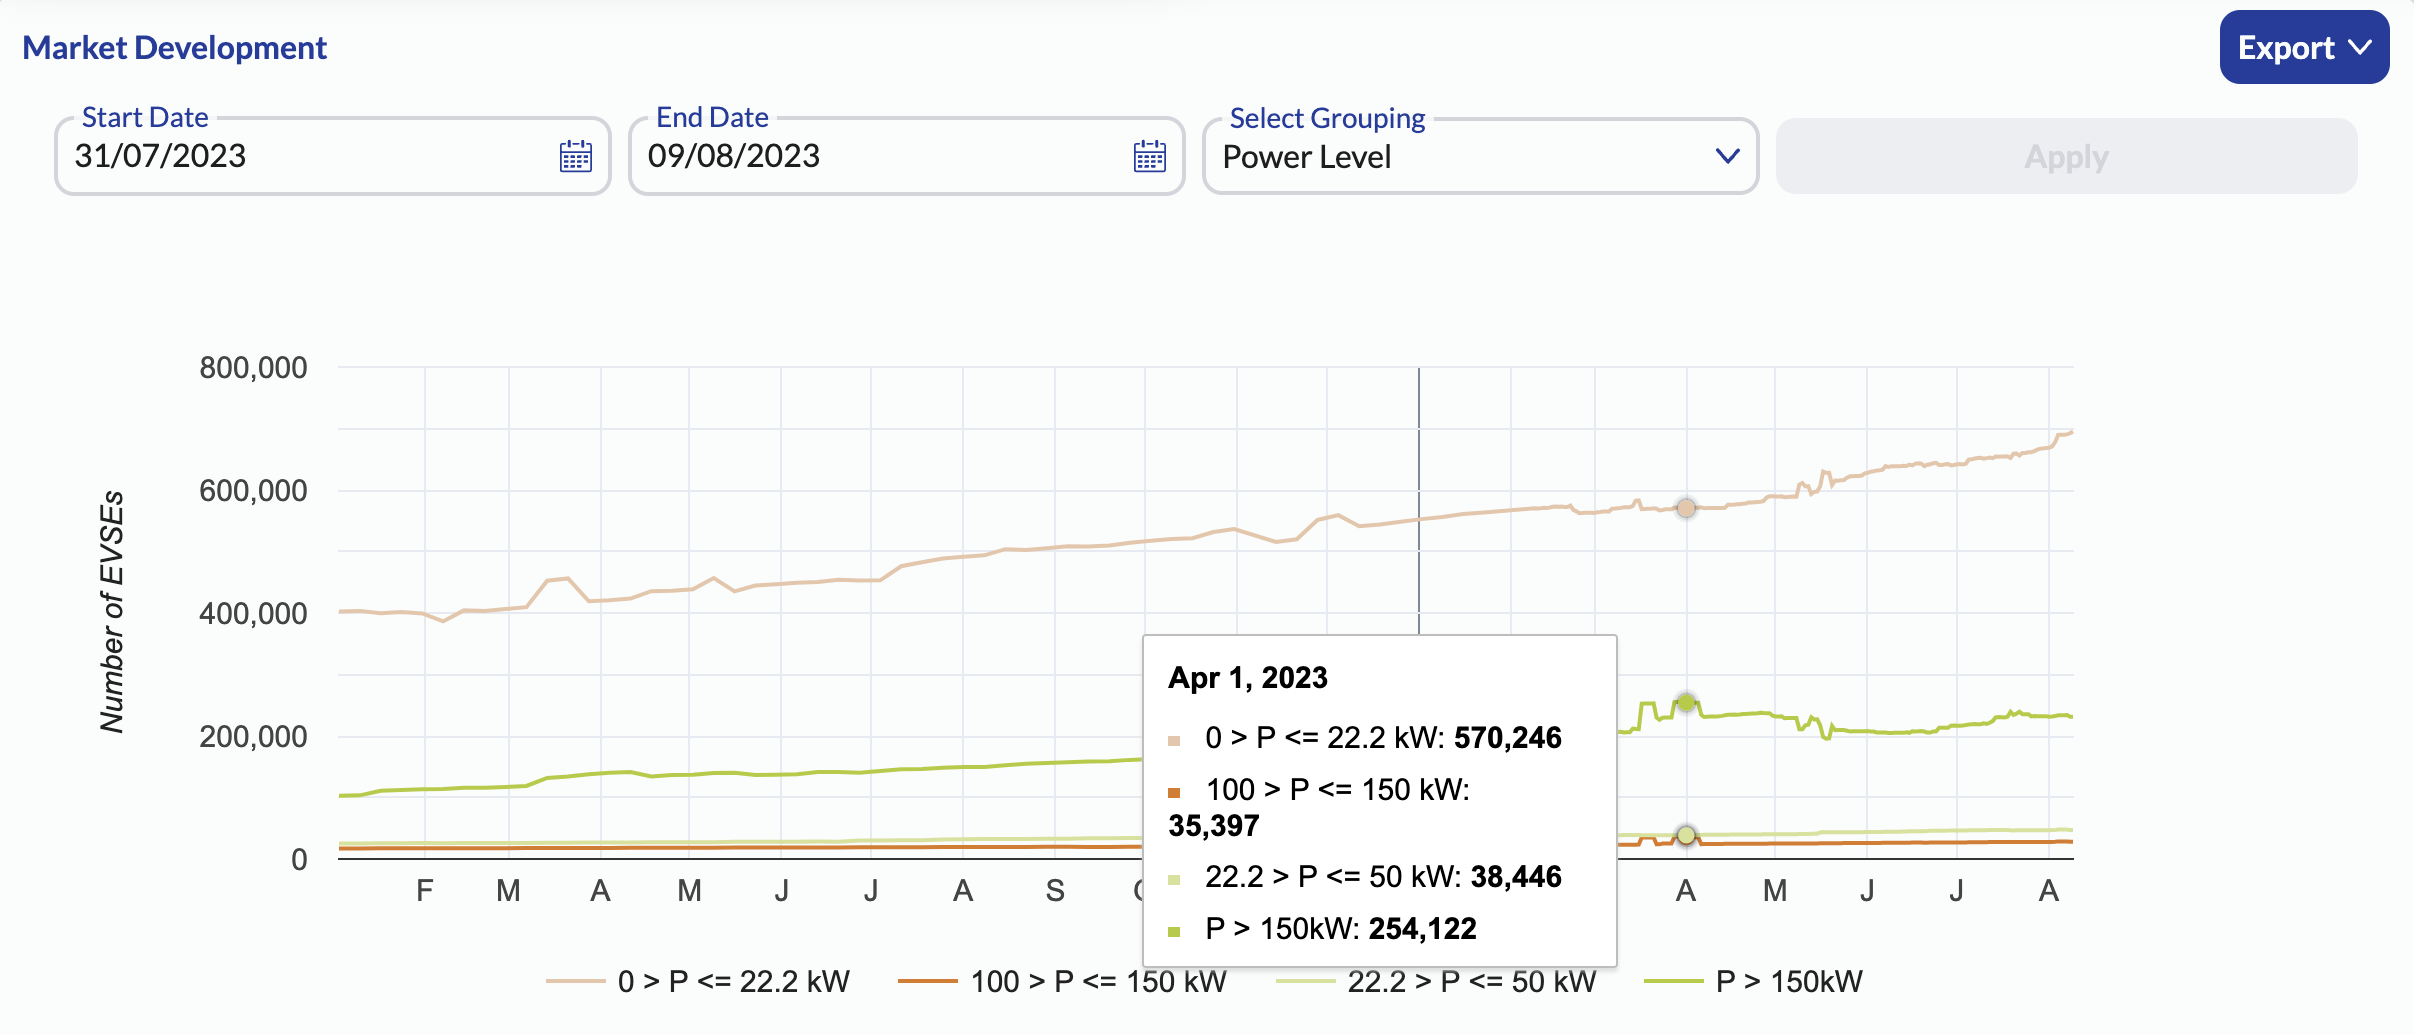
Settings
Use the Start Date and End Date drop-down menus to view the data for a specific time period.
Use the Select Grouping drop-down menu to group the data based on the country or region, power band, and access type.
Download
Click Export to download the data to a CSV or PNG file.